
What is a Justice Audit?
An independent, systematic, data-driven examination of how a justice system functions.
Fromwhat seems to be happening Towhat the evidence shows is happening.
An instrument for seeing how justice actually works.
Justice data often sit in separate institutions. Teams drawn from the international network maintained by Governance and Justice Group (GJG) and Justice Mapping (JM), with national partners embedded throughout, bring the evidence into one picture.
-
What it is
A system diagnostic that identifies pressure points and turns evidence into a prioritised Action Matrix and a time-bound Roadmap.
-
What it does
Connects data that normally sit in separate institutional silos and examines the justice system as a whole.
-
Why it works
Combines quantitative data with institutional knowledge, observation, practitioner and user experience, geographic analysis and verification.
Dysfunction in one institution may be caused – or amplified – by another.
The methodology examines the justice chain as a system. A court backlog may reflect problems in other institutions.
Illustrative example – select a pressure point
Pressure at CourtsAdjournments and a growing backlog at court.
- 1Prisons Delays can increase the remand population and pressure on prison capacity.
- 2Prosecution Files age, witnesses are lost and cases weaken.
- 3Legal aid Lawyers’ time is consumed by repeated hearings.
- 4Police Suspects wait longer in custody for a first hearing.
“A dysfunction in the system is seldom the fault of any one institution or actor.”
Seven kinds of evidence. One picture.
Its distinguishing strength: the Justice Audit consolidates a wealth of disparate evidence into actionable analyses. Separately, each layer shows part of the system. Aligned, they show where it is under pressure.
- 01Institutional data
- 02Case data
- 03Resources
- 04Infrastructure
- 05Geography
- 06Practitioner knowledge
- 07User experience
“Experience shows that justice data may be scattered, but they exist.”
Into actionable analyses that reveal
- 01What should happen
- 02What actually happens
- 03Where the system is under pressure
- 04Why
- 05What can realistically be changed
Seven stages. One established process.
Not simply a report.
The outputs are agreed for each assignment. The Action Matrix and Roadmap turn the evidence into priorities, responsibilities and measures of progress.
Baseline Dataset Visualisation Diagnostic Priorities Action Matrix and Roadmap Indicators National capacity a working evidence base
- 01
Baseline
A fixed point against which reform can be planned and measured.
- 02
Dataset
Integrated institutional and primary data, disaggregated where available by gender, age, disability and geography.
- 03
Visualisation
Maps and charts that make the whole system visible to decision-makers.
- 04
Diagnostic
Where the system is under pressure – and why.
- 05
Priorities
A short list of what to change first.
- 06
Action Matrix and Roadmap
Prioritised actions, responsible institutions, timeframes and measures of progress.
- 07
Indicators
Agreed measures of progress, set before reform begins.
- 08
National capacity
National teams able to maintain and update the evidence.
As it is meant to work. As it actually works.
A legal framework describes what should happen. A Justice Audit examines what happens in practice.
| Traditional assessment | Justice Audit | ||
|---|---|---|---|
| 01 | What does the law say? | What happens in practice? | |
| 02 | Institution by institution | The whole justice chain | |
| 03 | National averages | Granular geographic and institutional data | |
| 04 | Report findings | Actionable measures | |
| 05 | Consultant assessment | Evidence verified with institutions | |
| 06 | One-off study | A baseline capable of being updated | |
| 07 | Recommendations | Prioritised actions and indicators | |
| 08 | Data collected | Capacity transferred | |
| 09 | Secondary-source data | Institutional data plus primary research, disaggregated where available by gender, age, disability and geography |
From evidence to actionSee the Action Matrix and Roadmap
One evidence cycle. Repeat measurement.
The cycle supports Justice in 100 Days, Justice Audit – EU Accession Edition and Justice Audit – Investment Edition. Repeat measurements show what has changed and inform the next priorities.
- 01Map
- 02Collect
- 03Interrogate
- 04Compare
- 05Visualise
- 06Prioritise
- 07Measure again
Repeat measurements can update the baseline.
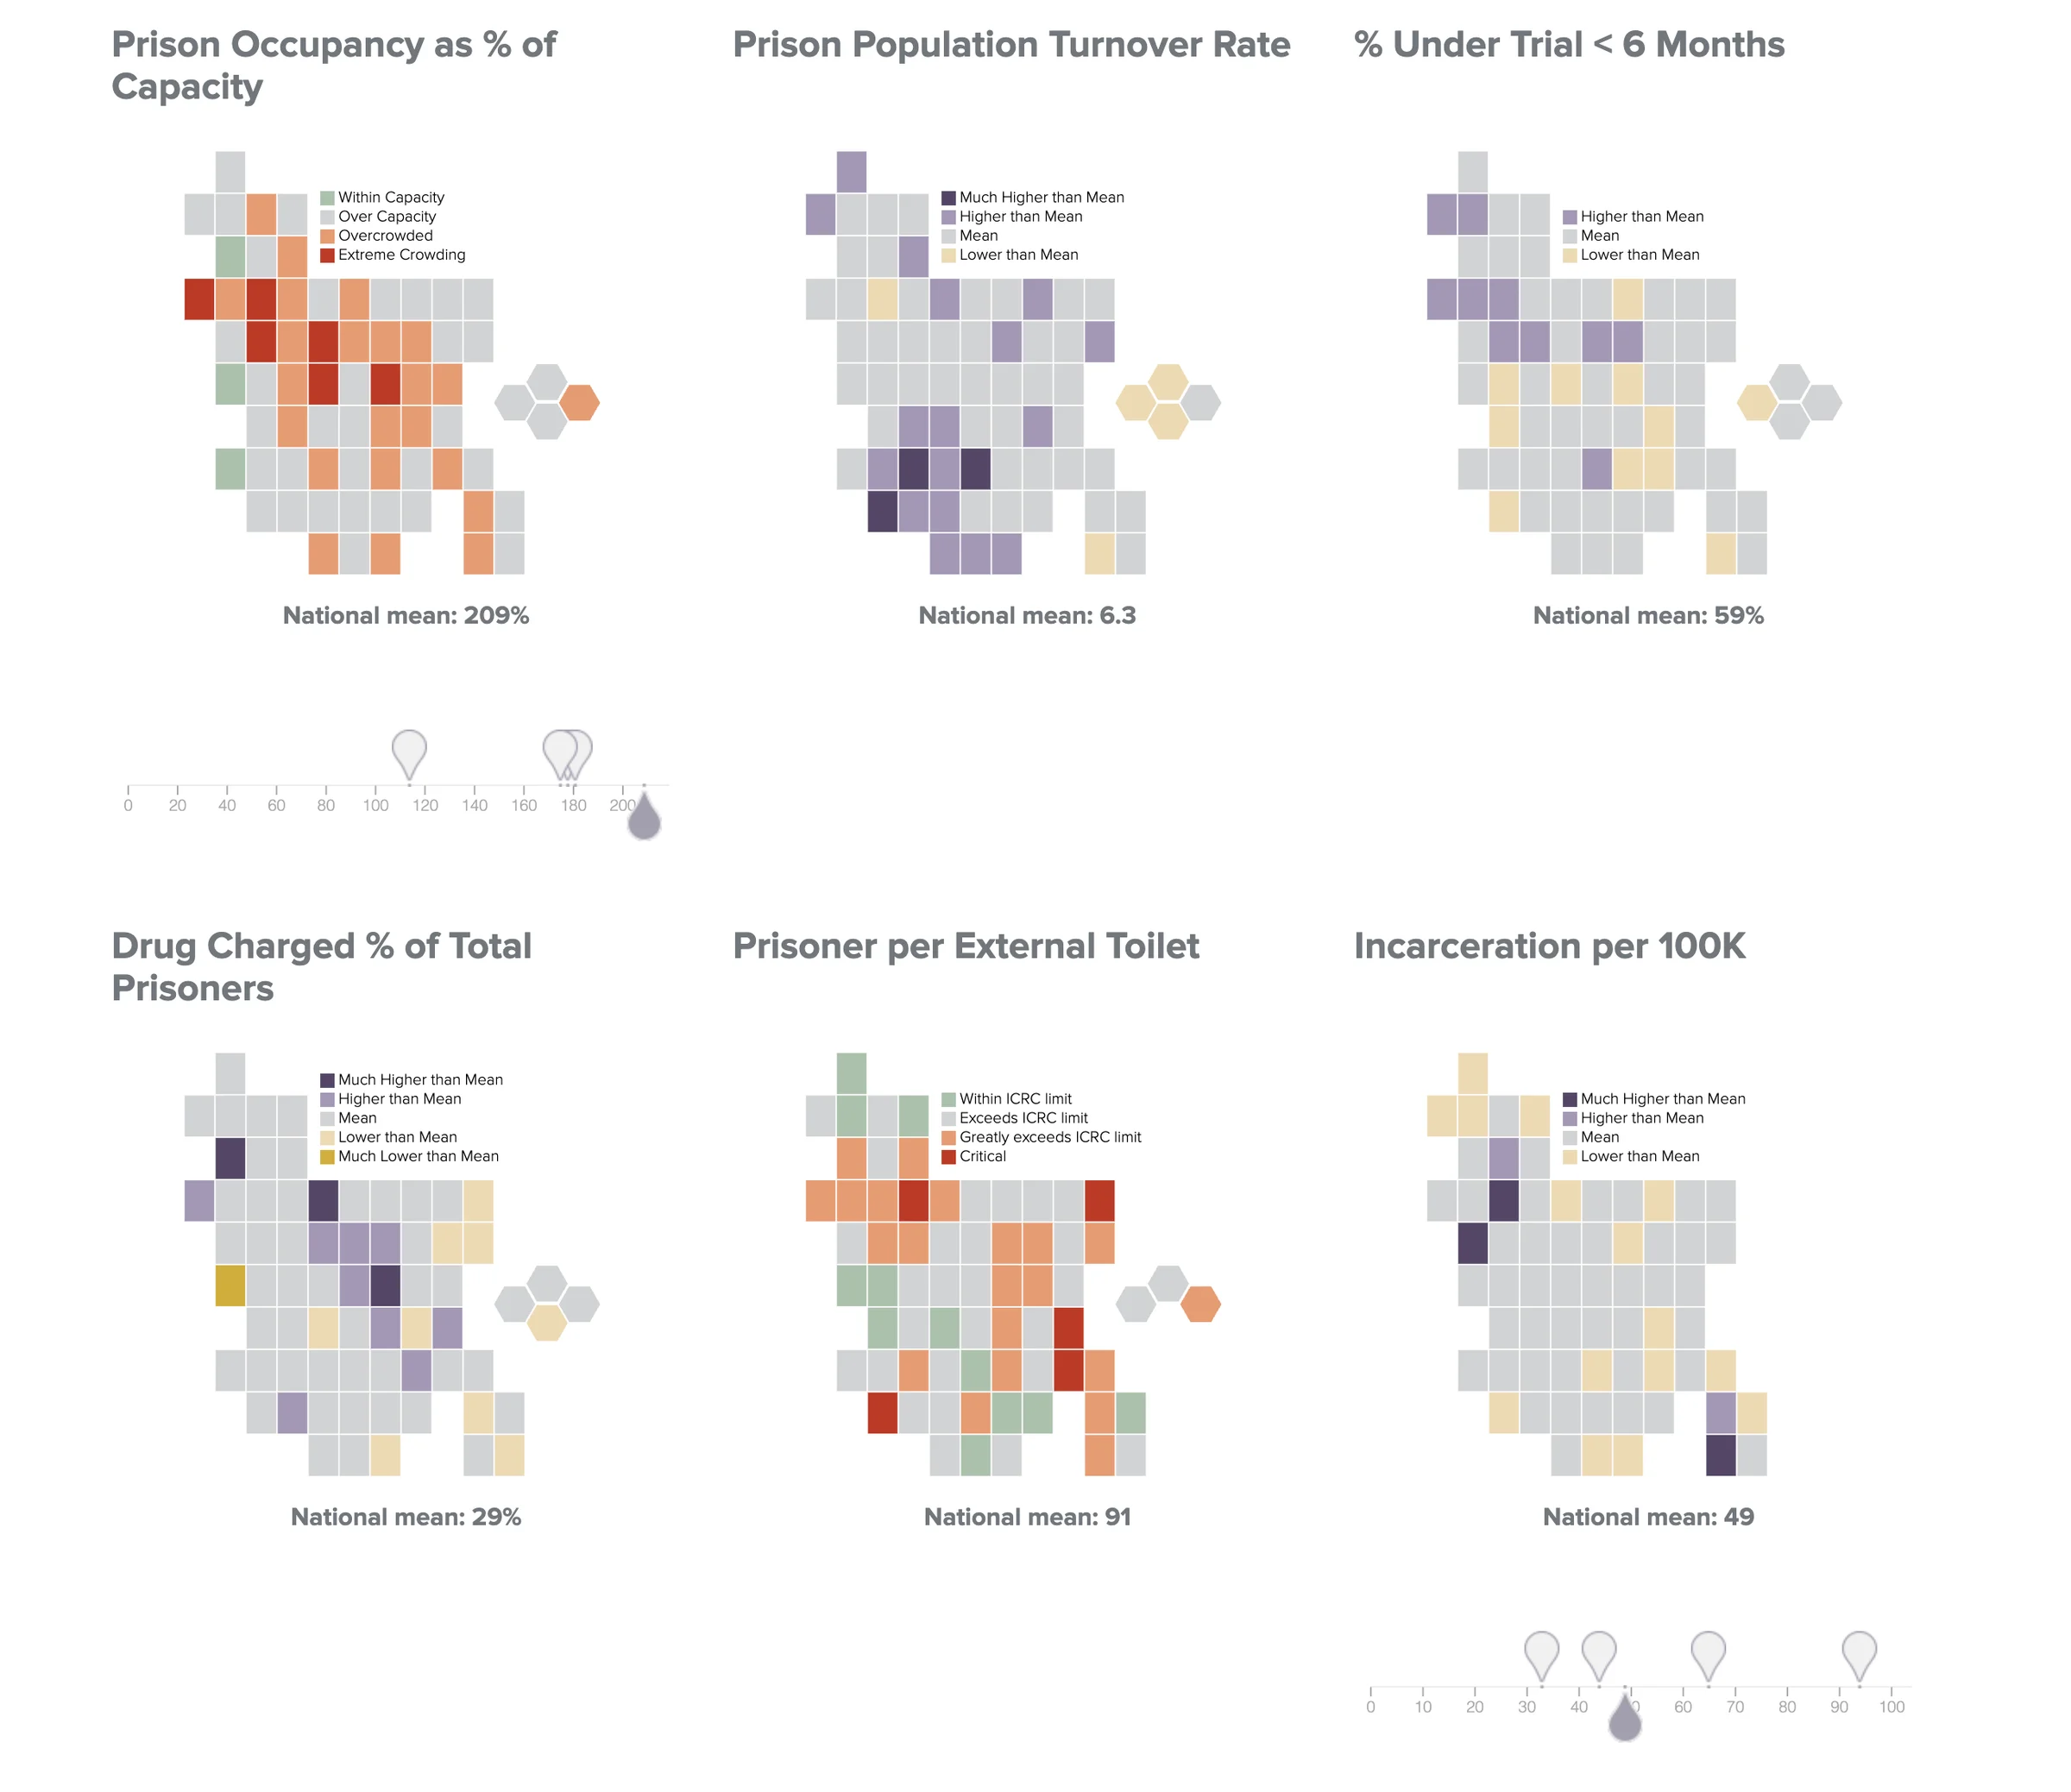
Bangladesh: the first national Justice Audit – all 64 districts.
The Bangladesh Justice Audit combined institutional data with citizen, court-user and practitioner evidence. It covered all 64 districts and cases entering the system in 2016, with national and district views.
- Evidence combined
- Institutional data, with citizen, court-user and practitioner evidence.
- Resolution
- The whole system, nationally and for each of the 64 districts.
- Transparency
- The underlying baseline data were made accessible.
- Integrity
- Data inconsistencies were explicitly identified rather than concealed.
- What followed
- The Government expanded Village Courts nationally and commissioned a Court Audit.
With the GIZ Rule of Law Programme, funded by BMZ and UK aid. Surveys by the Bangladesh Bureau of Statistics.
Explore the Bangladesh Justice Audit dashboard- 64districts examined – every case entering the system in 2016
- 209%mean prison occupancy against capacity, 31 December 2016
- >30%estimated reduction in backlog from Court Audit Case Management Orders (CMOs)
- Cases in courts and agencies
- Police investigations
- People: arrests and prison
Circle area ∝ volume
View the data
| Stage | Volume | Unit |
|---|---|---|
| Police investigations (FIR) | 216,370 | investigations |
| Chief Judicial / Metropolitan Magistrate Court | 1,449,219 | cases |
| District / Metropolitan Sessions Court | 690,964 | cases |
| High Court Division | 464,872 | cases |
| Appellate Division | 23,306 | cases |
| Nari o Shishu | 179,209 | cases |
| Village Court | Not shown | |
| NLASO legal aid (civil + criminal) | 111,024 | cases |
| People arrested | 541,052 | people |
| Prison admissions | 485,274 | people |
| Average daily prison population | 76,613 | people |
- Cases in courts and agencies
- Police investigations
- People: arrests and prison
Circle area ∝ volume
View the data
| Stage | Volume | Unit |
|---|---|---|
| Police investigations (FIR) | 29,056 | investigations |
| Chief Judicial / Metropolitan Magistrate Court | 195,743 | cases |
| District / Metropolitan Sessions Court | 126,756 | cases |
| Nari o Shishu | 17,756 | cases |
| Village Court | Not shown | |
| NLASO legal aid (civil + criminal) | 5,459 | cases |
| People arrested | 53,175 | people |
| Prison admissions | 57,389 | people |
| Average daily prison population | 7,367 | people |

Start with the question you are facing.
Start with a conversation about a specific problem. Choose the one closest to yours and tell us a little about your context.